

How MyLeagueRankings Calculates Team Rankings
Our power ranking uses one input: final scores. Here is what counts, how the three ratings are blended, how strength of schedule works, and what the ranking does not do.
By MyLeagueRankings ·
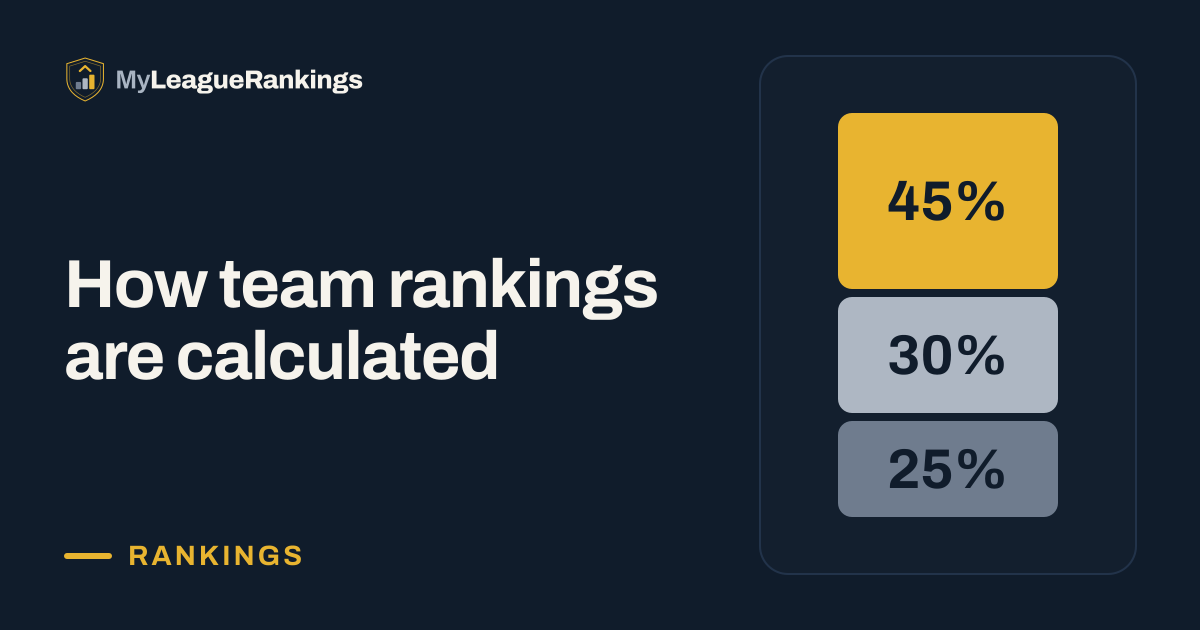
MyLeagueRankings ranks the teams in a flight from one input: the final scores of the games those teams played. Three ratings are computed from those scores and blended into a single number, and teams are ordered by it. Nobody votes, no team is seeded on reputation, and a club's name carries no weight.
What goes in
- Completed games with a final score. Every completed game in the flight that has a score for both teams is used.
- Published scores. Results come from the schedules and results published for each league. Nothing is entered by hand.
- Nothing that has not been played. A scheduled, postponed or cancelled game counts for nothing until a final score exists.
- Goals, not shootouts. The rating reads the goals scored. A game that ends level is a draw in the rating, even when penalty kicks decided who advanced.
The power ranking is built for league play. Cups and tournaments have their own group tables and brackets, and those are what we show for them.
Three ratings, one blend
Each rating answers a different question about the same set of results.
| Share | Rating | What it measures |
|---|---|---|
| 45% | Points per game, adjusted for strength of schedule | How often a team wins and draws, moved up or down by how strong its opponents were |
| 30% | Goal margin (a Massey rating) | How much a team wins or loses by, with large margins capped and a quarter-goal allowance for home field |
| 25% | Win, draw and loss (a Bradley-Terry rating) | Who beat whom, with the size of the score ignored |
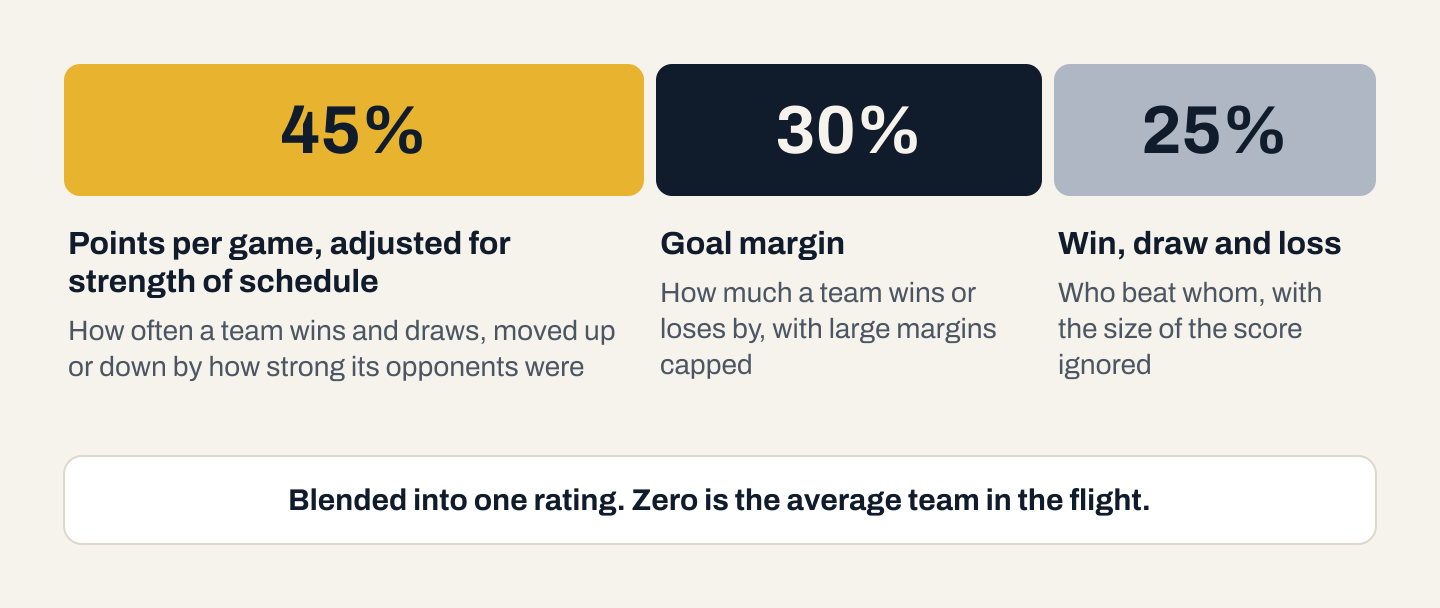
The three are put on a common scale before they are blended, so no single one dominates because of its units. The result is the rating teams are ordered by. Zero is the average team in that flight, a positive number is above average, and a negative number is below.
One detail to know: the points-per-game part always counts 3 points for a win and 1 for a draw. Many youth leagues award points differently in their official tables. That does not change the rating. The league's own standings are shown separately, using the league's own rules.
Strength of schedule
Two teams with the same record have not necessarily done the same thing. One may have played the top half of the flight and the other the bottom half.
Strength of schedule, shown as SOS, is the average points per game your opponents earned in their other games. The games against you are left out, so beating an opponent does not make your own schedule look weaker and losing to them does not make it look stronger.
A team with a strong schedule gets credit on top of its points per game. A team with a soft schedule gives some back.
Why a 9-0 win does not count nine times
Running up a score says little about a team that an ordinary win did not already say. The goal-margin rating caps large wins, so one lopsided result cannot carry a team up the table.
Early in a season the ranking is deliberately cautious. With only a few games played, big wins are capped harder and every team is pulled toward the average. As more games are played that caution loosens and results speak for themselves. Expect ranks to move more in the first weeks than they do later on.
Ties
When two teams are too close to separate, they share a rank. You will see it written with a T, as in T7. A shared rank is a statement that the results so far do not justify putting one team above the other.
One flight at a time
Ratings are compared inside a flight, which is one group of teams of one age and sex playing each other in a league. Teams in different flights rarely meet, and without games between them there is nothing to measure.
For that reason we do not publish one list across age groups or across leagues. Our pyramid pages place leagues level by level and show the teams leading their flights, not a national ladder. The longer argument for that choice is in why youth soccer rankings are so hard.
The same idea applies inside a flight. If a flight splits into groups of teams that have not played each other yet, each group is ordered by its own results, but there is little evidence for how the groups compare until games connect them.
When rankings update
Rankings are recomputed when a new final score comes in. A weekly ranking is also saved every Monday. The movement shown beside a team compares its current rank with the latest Monday ranking, and the Monday ranking itself is compared with the Monday before. A team has no movement figure until an earlier Monday ranking exists to compare with.
If a league corrects a score, the ranking is recomputed from the corrected result.
What the ranking is not
- Not the official standings. Your league decides its champion with its own points table and tiebreakers. A flight page can be switched to that standings order. See how to read a league table.
- Not a rating of players. It measures team results in one flight in one season.
- Not a prediction of next season. Rosters, coaches and levels change, and the ranking starts again from the games played.
See it on real leagues
Open any league from the leagues page and pick a flight to see its ranking, with each team's record, goal difference and movement. Ratings and strength of schedule are free with an account. To find a specific team, use team search. You can also watch a live ranking.
If the names of the groupings are unfamiliar, start with our glossary of league terms.