
How to Read a Soccer League Table: Points, Tiebreakers and What a Ranking Adds
What every column in a league table means, how points and tiebreakers work in youth soccer, why a table can mislead mid-season, and what a power ranking adds to it.
By MyLeagueRankings ·

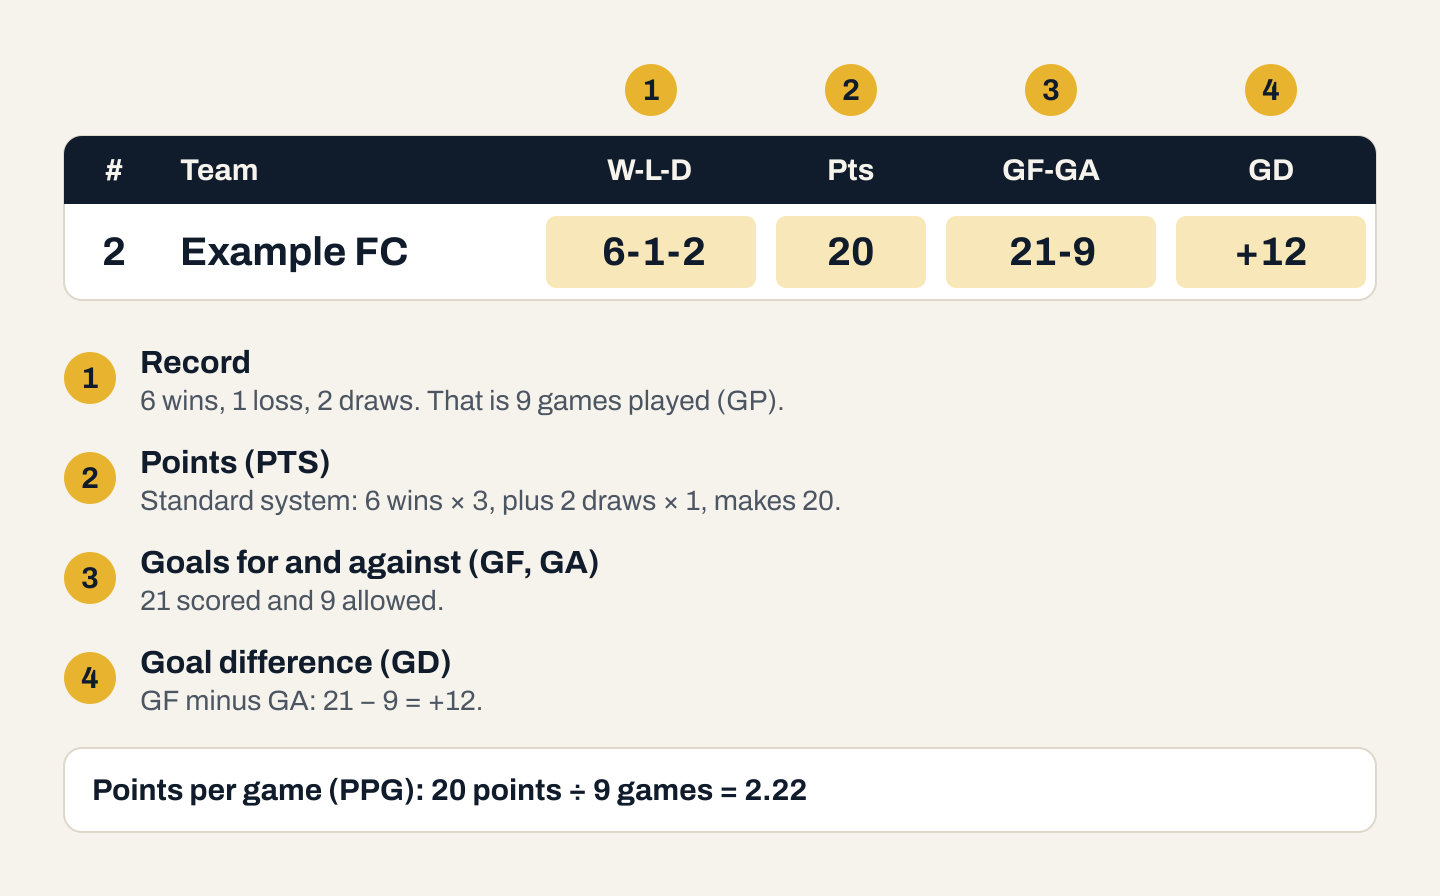
A league table orders teams by points. A team earns points from each result, the team with the most points is first, and teams level on points are separated by tiebreakers such as goal difference. That is the whole idea. The details that trip people up are the column names, the points system your league uses, and the order of its tiebreakers.
The columns
| Column | Meaning |
|---|---|
| GP | Games played |
| W, D, L | Wins, draws and losses. Some tables write T for a tie |
| GF | Goals for: goals the team has scored |
| GA | Goals against: goals the team has allowed |
| GD | Goal difference: GF minus GA |
| PTS | Points |
| PPG | Points per game: PTS divided by GP |
A record written as 6-1-2 is usually wins, losses, draws in American leagues and wins, draws, losses elsewhere. Check the header before you assume. Our own tables write the record as W-L-D: wins, losses, draws.
Points systems
The standard system is 3 points for a win, 1 for a draw and 0 for a loss. Most professional and college leagues use it, and so do many youth leagues. It is not universal in the youth game. These are the systems we see most.
| System | How points are earned |
|---|---|
| Standard | 3 for a win, 1 for a draw |
| Win plus goals | 3 for a win, 1 for a draw, plus 1 per goal scored, up to 3 |
| Shootout | 3 for a win, 2 for a shootout win, 1 for a shootout loss |
| Ten-point | 6 for a win, 3 for a draw, 1 per goal up to 3, 1 for a shutout, with 10 the most a team can earn from one game |
The ten-point system is common in youth leagues and tournaments. It rewards scoring and clean sheets, and it means a 1-0 win and a 3-0 win are not worth the same. If a table's points do not add up under the standard system, this is usually why.
Tiebreakers
When two teams have the same points, the league's tiebreakers are applied in a fixed order until one separates them. A common order is:
- Points
- Goal difference
- Goals for
Many youth leagues put head-to-head first, so the result between the two tied teams decides it before goal difference does. Other criteria you will see include goals against, number of wins, shutouts, and fair play, which counts cards. A penalty shootout or a drawing of lots is the last resort.
Two youth-specific rules are worth knowing:
- Goal difference caps. Many leagues count no more than a set margin per game toward goal difference, so that a blowout does not help in a tiebreaker.
- Head-to-head with three teams. When three or more teams are tied, head-to-head is applied among all of them, and it can produce a different order than you would expect from any single result.
The league's own rules page has the order that applies to your table.
Why a table can mislead
A table is exact about what has happened. It is less reliable as a measure of how good each team is, for a few reasons.
- Unequal games played. Mid-season, a team with more games has had more chances to earn points. Points per game corrects for this.
- Unequal schedules. Not every team has played the same opponents yet, and in some leagues they never will. A team that has played the top three is not in the same position as one that has played the bottom three.
- Separate brackets. When an age group is split into Bracket A and Bracket B, each has its own table. First place in one does not compare directly with first place in the other.
- Small samples. A youth season is short. One result moves a team a long way.
- Unplayed games. Postponed games leave gaps that are filled later, sometimes all at once.
A ranking has limits of its own, which we cover in why youth soccer rankings are so hard.
What a ranking adds
The official standings decide titles, promotion and seeding. A power ranking answers a different question: based on the results so far, how strong does each team look?
On MyLeagueRankings a flight page shows the power ranking and can be switched to the standings order. The ranking adds three things the table does not have.
- Strength of schedule. It accounts for how strong each team's opponents were.
- Margin, with a cap. It gives some credit for winning comfortably, with large wins capped so that running up the score is not rewarded.
- Comparable numbers. It rates every team on one scale where zero is the flight average, whatever points system the league uses.
When the table and the ranking agree, there is not much to argue about. When they disagree, the gap is usually explained by schedule: a team sits high in the table after an easy start, or low after a hard one. The full method is in how rankings are calculated.
A short checklist
- Check which points system the league uses.
- Look at games played before comparing points, or compare PPG.
- Find the tiebreaker order in the league rules.
- Note who each team has played so far.
- Use the ranking for context and the standings for what is official.
Try it on a real table
Pick a league on the leagues page and open a flight to compare its power ranking with its standings order, or find a team through team search. For cups and tournaments, where group tables feed a bracket, see how cup pathways work. For any term used here, see the glossary of league terms.