
Why Youth Soccer Rankings Are So Hard (and Why So Many Compare Apples to Oranges)
Rosters change every season, kids develop at different speeds, and most teams never play each other. Here is why so many youth soccer rankings compare unlike things, and what a fair one needs.
By MyLeagueRankings ·
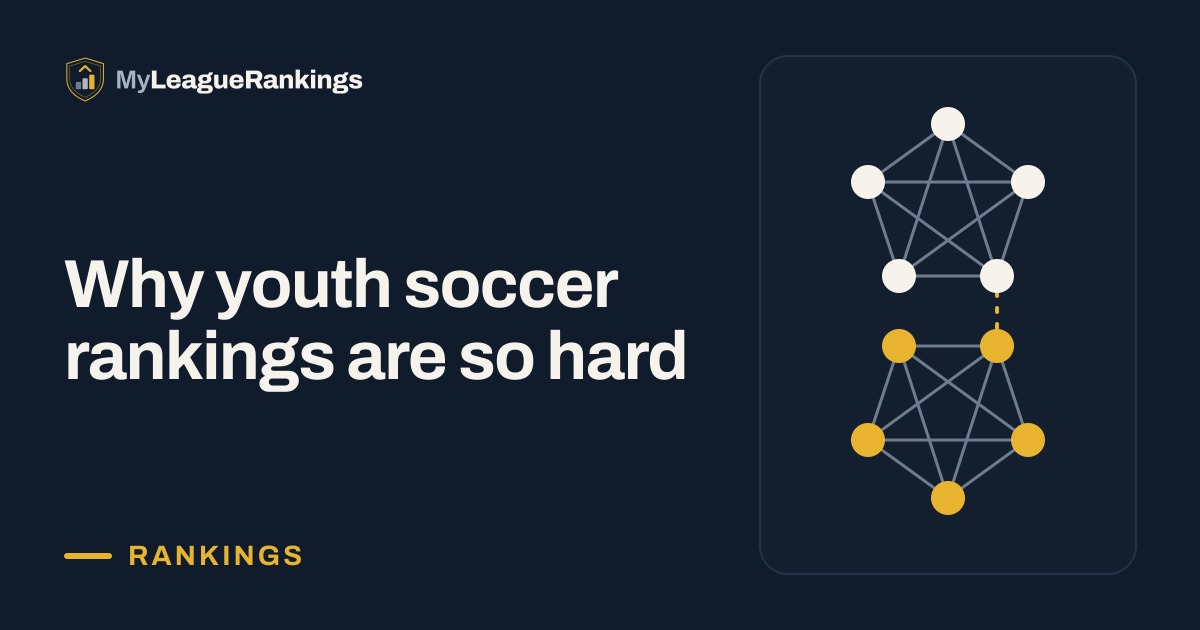
Youth soccer rankings are hard because a ranking is a comparison, and most of the comparisons people want cannot be made from the games that were played. The team under a name changes from one season to the next, children develop at different speeds, and most teams never meet most other teams. A list that ignores those three facts compares apples to oranges, however exact its numbers look.
A ranking is only as good as the comparison underneath it.
The team is not the same team
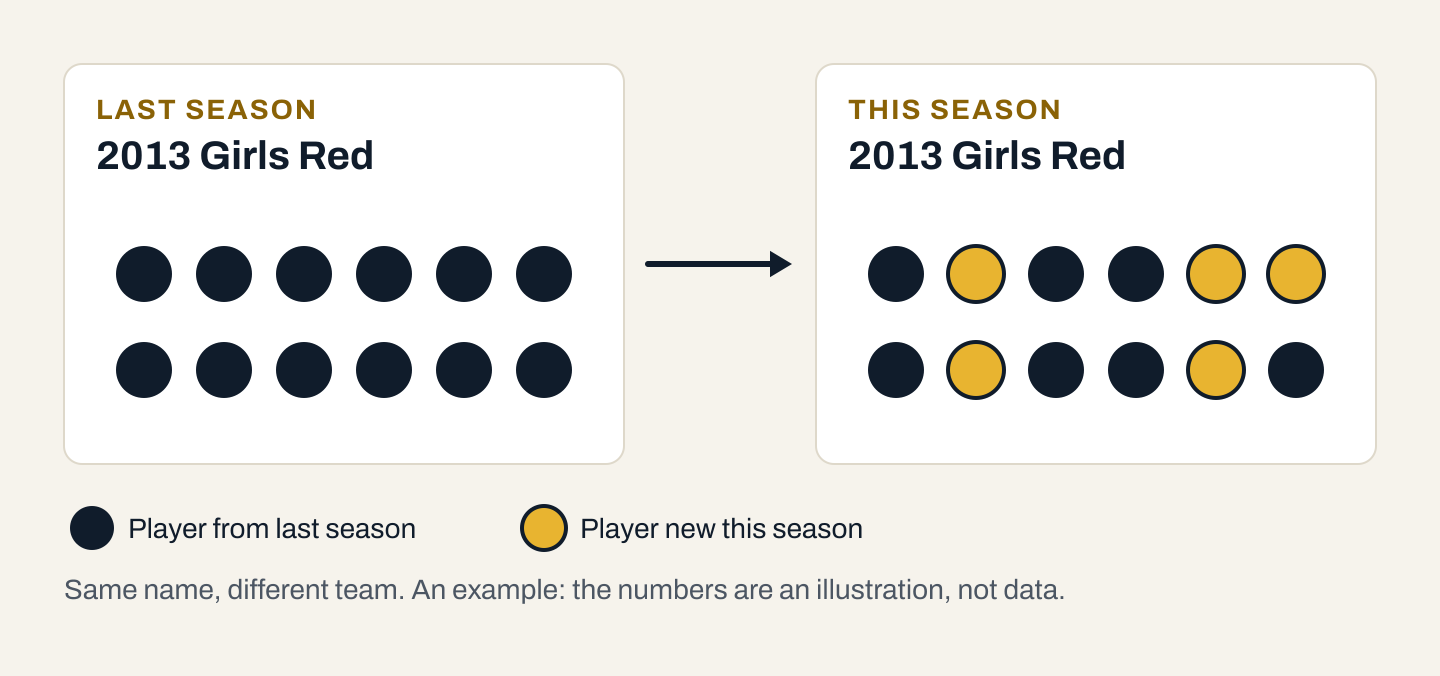
A team name survives from year to year. The group of players under it often does not.
- Tryouts. Competitive clubs typically hold tryouts every year. Players are added, released, and moved between a club's first and second teams.
- Players changing clubs. A few players leaving or arriving can change a team's level.
- Merges and splits. Two teams become one, or one group is divided into two.
- Coaches. A new coach can change how a team plays and who plays.
So a name like "2013 Girls Red" can stand for a substantially different group a year later. A rating carried from one season into the next assumes the team is the same team. Often it is not, and the carried-over number describes players who are no longer there.
Kids change fast, and not on the same schedule
Children grow in spurts, and not at the same ages. Two players in one age group can be far apart in size, speed and coordination, and that gap can close or reverse within a couple of years. Technical skill develops unevenly too.
Then there is the relative age effect, which is well documented in youth sports. Players born soon after the cutoff date are the oldest in their group, by up to a year, and they tend to be over-represented on selective teams at the younger ages. That head start matters a great deal at ten and far less at seventeen.
A result at U11 says little about the same players at U14. A ranking of young teams measures who is ahead now, which is not the same as who will be ahead later.
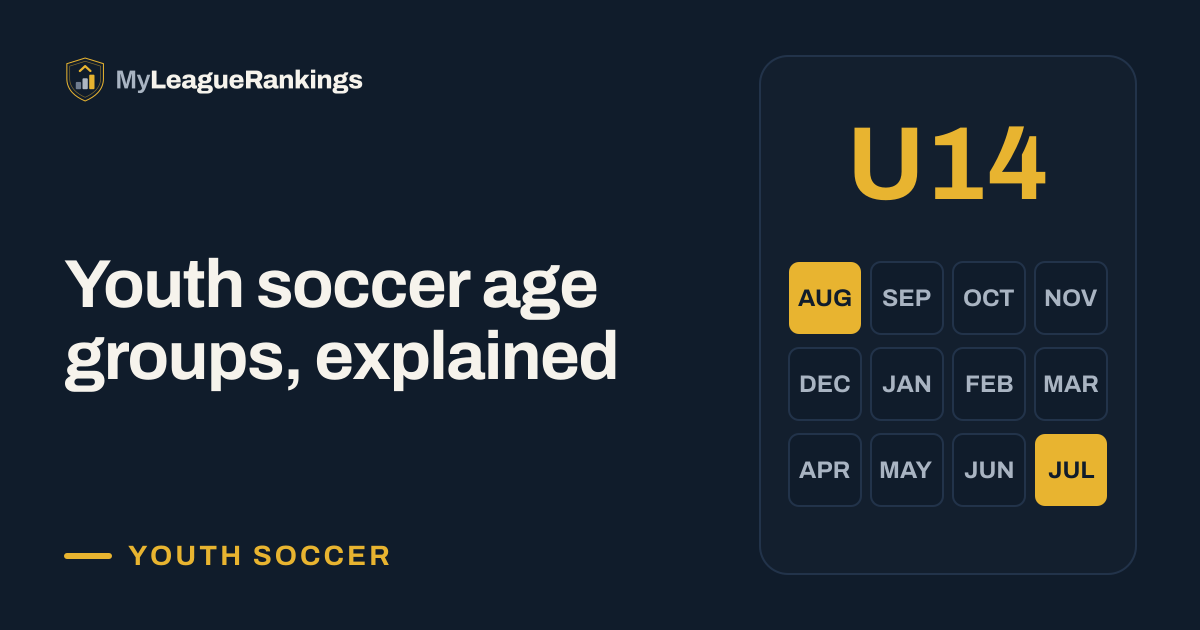
The cutoff itself has just moved. From the 2026-27 season, US Youth Soccer, US Club Soccer and AYSO group players by a twelve-month window that starts on August 1 instead of by calendar birth year, as covered in youth soccer age groups explained. Players born in the same calendar year can now fall into two different age groups, and the oldest players in a group are no longer the same ones. That is one more break between last season's teams and this season's.
Teams that never played each other
Two teams can be compared directly when they have played each other. They can be compared indirectly when they share opponents: if A beat B and B drew with C, there is some evidence about A and C. Every link in that chain adds uncertainty.
Inside one league group the chain is short and well supported, because the teams play each other all season. Between two leagues it is usually thin. It may rest on a single tournament weekend where a few teams from each league met, perhaps with guest players on the roster and a different format from league play. Sometimes there is no chain at all.
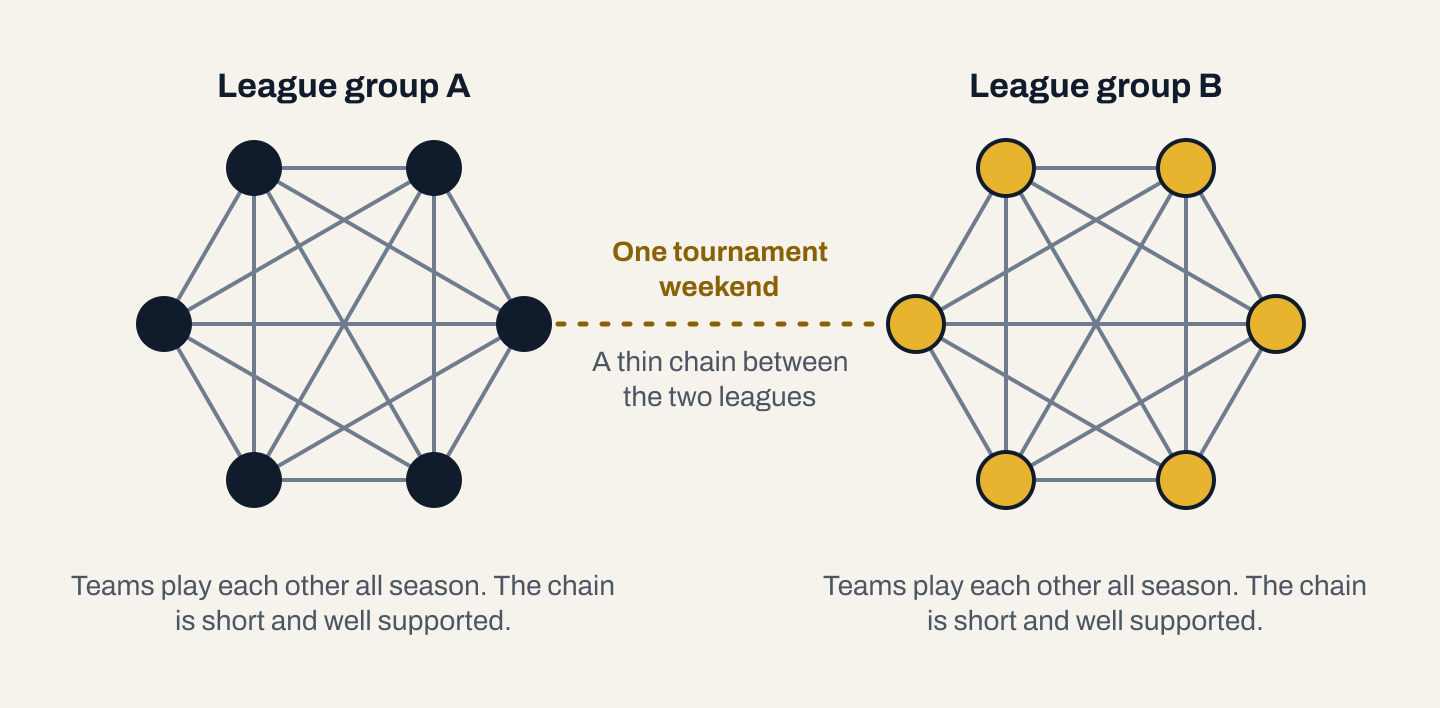
When the chain is thin, the number that puts a team in one league above a team in another is an extrapolation, not a measurement. Leagues also differ in ways that change what a score means: the length of a game, roster and substitution rules, and how forfeits and shootouts are recorded.
Apples, bananas and oranges
In our view, the common mistake is to put everything on one ladder.
| What gets mixed | Why it is not like for like |
|---|---|
| League games with tournament, showcase and friendly games | They are played for different purposes. A showcase is scheduled for exposure, and a friendly does not count toward any table |
| Age groups | A U13 result and a U15 result do not sit on one scale |
| Seasons | Last season's results belong to last season's roster |
| Leagues and regions | The teams are joined by few games, or by none |
A national list that puts all of that in one column gives every team an exact position. The exactness comes from the arithmetic. The evidence underneath is uneven: solid where teams played each other often, and thin where they barely met. A single column hides that difference.
What a fair comparison needs
- The same teams in the same season.
- Games of the same kind, played under the same rules.
- Teams that actually played each other, or that share enough opponents.
- Enough games for the results to mean something.
- A plain statement of what cannot be compared.
That is the reasoning behind how MyLeagueRankings is built. Our power ranking is computed inside one flight, for one season, from the completed games of that flight. A flight is one group of teams of one age and sex playing each other in a league, so the teams being compared are the teams that meet.
- One flight per ranking. Each ranking page covers a single flight. Our pyramid pages show the teams leading their flights, never one list across age groups.
- Strength of schedule inside the flight. A team's rating accounts for how its opponents did in their other games.
- Caution early in the season. With few games played, every team is pulled toward the average and big wins are capped harder.
- Unconnected groups stay unconnected. If a flight splits into groups of teams that have not played each other yet, each group is ordered by its own results, and there is little evidence for how the groups compare until games connect them.
- Cups and tournaments keep their own tables. For those we show the group tables and the bracket.
- A new season starts from its own games. Nothing is assumed about a roster that may have changed.
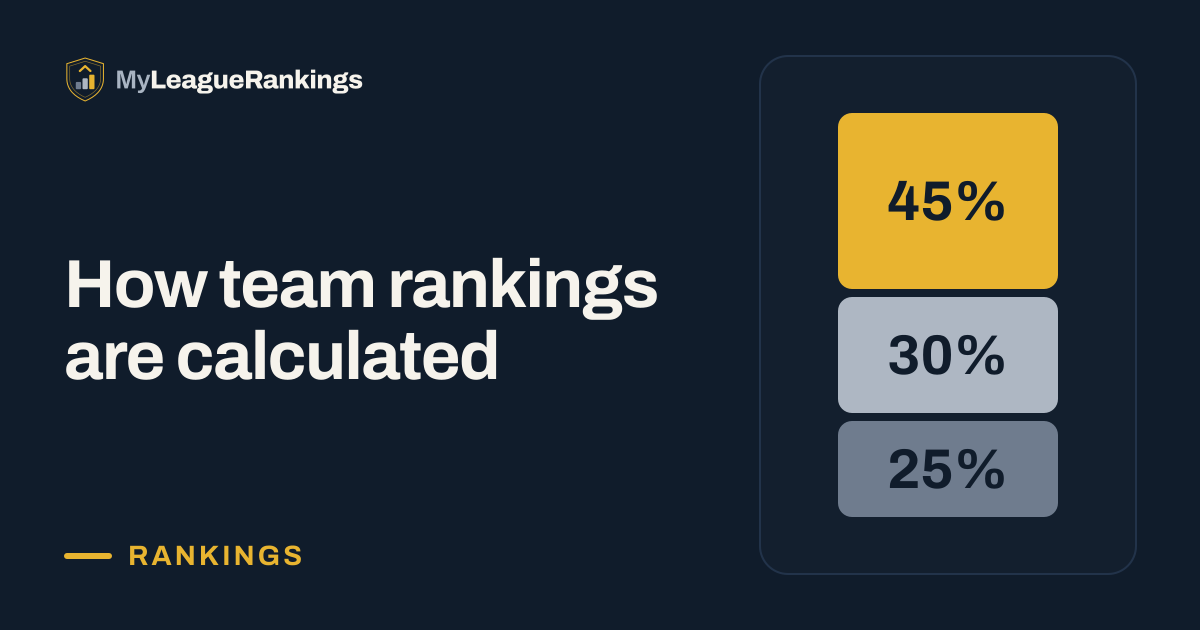
The cost is real. A flight ranking will not tell you whether a team in one state would beat a team in another state that it has never played. We think saying so is better than printing a number. The method itself is described in how rankings are calculated.
What a ranking is good for
A ranking is a summary of results so far among teams that played each other. It tells you how a team is doing in its flight once schedule and margin are taken into account, and it adds context to the official standings, as described in how to read a league table.
It is not:
- A prediction of a child's future. A team's rank says nothing about one player.
- A judgment of a club. One team's season in one flight does not describe a whole club.
- A reason to pick a team. Coaching, playing time, cost and travel matter more than a position in a table.
To see a ranking kept inside those limits, open any league on the leagues page and pick a flight, or watch a live ranking.